배경
Next.js 보안 취약점이 발견되어 버전 업데이트를 진행했습니다.
Next.js 9.5.5 ~ 14.2.14 버전에서 pathname을 기준으로 middleware에서 인증을 수행할 경우,
root directory 바로 아래에 위치한 페이지에 대해 인증이 우회될 가능성 있다고 합니다.
이미 14 버전을 사용하고 있었기 때문에 패치 버전인 14.2.15로의 수정은 간단할 것이라고 예상했습니다.
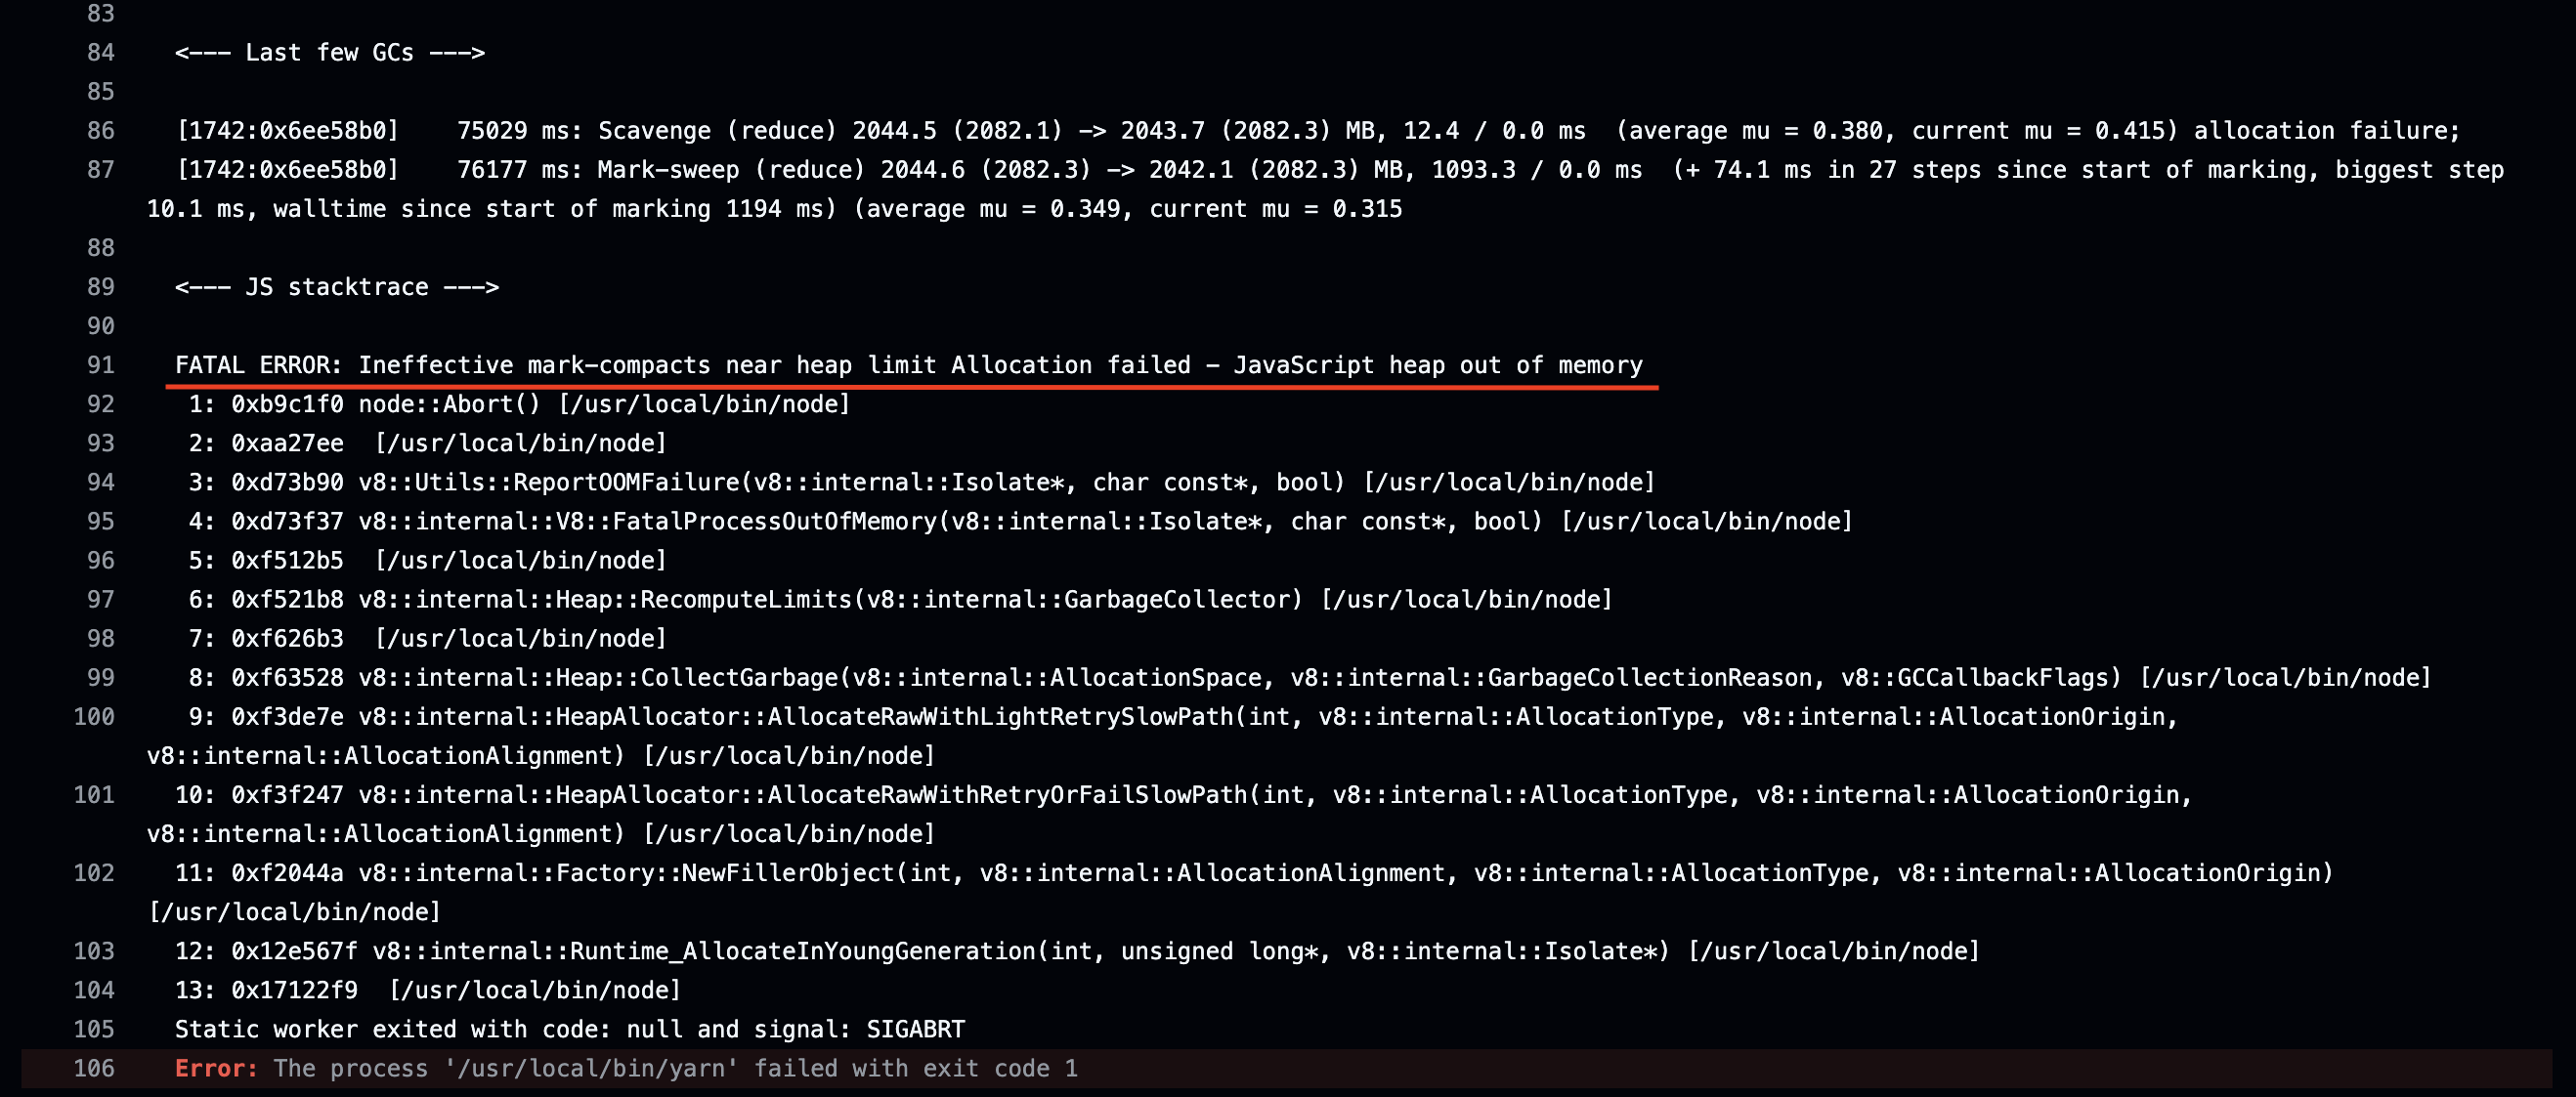
단순히 버전 업데이트만 진행했는데, 아래와 같은 에러를 만나게 되었습니다.
'메모리'를 키워드로 검색하던 중, Next.js 공식 문서의 Memory Usage 페이지를 발견했습니다.
이 페이지에서는 메모리를 최적화할 수 있는 몇 가지 전략을 소개하고 있습니다.
그중 'Run next build with --experimental-debug-memory-usage' 부분이 눈에 들어왔습니다.
Starting in 14.2.0, you can run
next build --experimental-debug-memory-usageto run the build in a mode where Next.js will print out information about memory usage continuously throughout the build, such as heap usage and garbage collection statistics. Heap snapshots will also be taken automatically when memory usage gets close to the configured limit.
14.2.0 버전을 사용하고 있다면 위와 같이 빌드를 실행해서 메모리 사용량, 힙 사용량, 가비지 컬렉션 통계를 확인할 수 있습니다.
메모리 사용량이 한계에 가까워지면 힙 스냇샵도 자동으로 생성된다고 합니다.
관련 PR은 여기에서 확인할 수 있습니다.
OOM 원인 파악을 위해 package.json의 scripts에 아래 내용을 추가하고 yarn build:memory로 memory usage부터 측정했습니다.
"scripts": {
  "build:memory": "next build --no-lint --experimental-debug-memory-usage"
}
측정 결과
✓ Checking validity of types
  Creating an optimized production build ...

  ***************************************
  Memory usage report at "Starting build":
    - RSS: 546.41 MB
    - Heap Used: 47.75 MB
    - Heap Total Allocated: 80.22 MB
    - Heap Max: 4144.00 MB
    - Percentage Heap Used: 1.15%
  ***************************************


  ***************************************
  Memory usage report at "periodic memory snapshot":
    - RSS: 1843.94 MB
    - Heap Used: 854.81 MB
    - Heap Total Allocated: 894.55 MB
    - Heap Max: 4144.00 MB
    - Percentage Heap Used: 20.63%
  ***************************************

Browserslist: caniuse-lite is outdated. Please run:
  npx update-browserslist-db@latest
  Why you should do it regularly: https://github.com/browserslist/update-db#readme

  ***************************************
  Memory usage report at "periodic memory snapshot":
    - RSS: 2700.94 MB
    - Heap Used: 929.57 MB
    - Heap Total Allocated: 1018.14 MB
    - Heap Max: 4144.00 MB
    - Percentage Heap Used: 22.43%
  ***************************************

⚠ Long running GC detected: 33.34ms

  ***************************************
  Memory usage report at "periodic memory snapshot":
    - RSS: 5521.45 MB
    - Heap Used: 2292.80 MB
    - Heap Total Allocated: 2659.59 MB
    - Heap Max: 4144.00 MB
    - Percentage Heap Used: 55.33%
  ***************************************

✓ Compiled successfully

  ***************************************
  Memory usage report at "Finished build":
    - RSS: 5524.50 MB
    - Heap Used: 2294.99 MB
    - Heap Total Allocated: 2661.28 MB
    - Heap Max: 4144.00 MB
    - Percentage Heap Used: 55.38%
  ***************************************

⚠ Long running GC detected: 28.30ms
  Collecting page data  .(node:45682) NOTE: The AWS SDK for JavaScript (v2) will enter maintenance mode
on September 8, 2024 and reach end-of-support on September 8, 2025.

Please migrate your code to use AWS SDK for JavaScript (v3).
For more information, check blog post at https://a.co/cUPnyil
(Use `node --trace-warnings ...` to show where the warning was created)

✓ Collecting page data

  ***************************************
  Memory usage report at "Finished collecting page data":
    - RSS: 1471.89 MB
    - Heap Used: 568.96 MB
    - Heap Total Allocated: 1078.22 MB
    - Heap Max: 4144.00 MB
    - Percentage Heap Used: 13.73%
  ***************************************

(node:45687) NOTE: The AWS SDK for JavaScript (v2) will enter maintenance mode
on September 8, 2024 and reach end-of-support on September 8, 2025.

Memory usage report:
- Total time spent in GC: 2734.80ms
- Peak heap usage: 2294.99 MB
- Peak RSS usage: 5524.50 MB
순서
Memory usage report at "Starting build"로 시작Memory usage report at "periodic memory snapshot"여러 번 출력Memory usage report at "Finished build"출력Memory usage report at "Finished collecting page data"출력- 마지막에 Memory usage report 출력
메모리 지표
| 종류 | 설명 |
|---|---|
| RSS (Resident Set Size) | 프로세스가 RAM에서 차지하고 있는 메모리의 크기 |
| Heap Used | 현재 사용 중인 힙 메모리 크기 |
| Heap Total Allocated | V8 엔진이 할당한 전체 힙 메모리 크기 |
| Heap Max | 프로세스가 사용할 수 있는 최대 힙 메모리 크기 (--max-old-space-size 옵션으로 조정 가능) |
| Percentage Heap Used | 전체 할당된 힙 메모리에서 실제 사용 중인 힙 메모리의 비율 |
| Total time spent in GC | Garbage Collection에 소요된 시간 |
| Peak heap usage | 최대 힙 메모리 사용량 |
| Peak RSS usage | 최대 RSS 사용량 |
마치며
마주했던 경우는 aws-sdk가 문제 중 하나였고 이미 관련 이슈가 올라온 적 있었습니다.
// as-is
import AWS from 'aws-sdk';

// to-be
import S3 from 'aws-sdk/clients/s3';
이슈를 참고해 단순히 import 구문들만 수정했음에도 불구하고 아래와 같은 감소를 확인할 수 있었습니다.
# as-is
Memory usage report:
- Total time spent in GC: 2734.80ms
- Peak heap usage: 2294.99 MB
- Peak RSS usage: 5524.50 MB

# to-be
Memory usage report:
- Total time spent in GC: 1422.29ms
- Peak heap usage: 1573.20 MB
- Peak RSS usage: 4561.08 MB
어차피 aws-sdk v2는 올해 9월 8일부터 end of support 예정이기 때문에 v3로 마이그레이션 작업을 진행했습니다.
v2가 single package였던 것과 달리, v3는 modularized packages를 제공합니다.
aws-sdk 전체를 설치하는 대신,
필요한 모듈인 @aws-sdk/client-s3, @aws-sdk/client-cloudwatch, @aws-sdk/lib-storage만 선택적으로 설치할 수 있어
마이그레이션 작업 이후 한 번 더 메모리 사용량이 감소했습니다.
Memory usage report:
- Total time spent in GC: 1453.06ms
- Peak heap usage: 1336.11 MB
- Peak RSS usage: 2992.16 MB.github/workflows/on-pull-request.yml에 build-script: 'next build --no-lint --experimental-debug-memory-usage'로
메모리 사용량 개선에 유용했던 플래그를 추가해 로컬 환경이 아니더라도 지속적으로 확인할 수 있도록 만들었습니다.
Next.js 버전 14.2.0 이상을 사용하고 있다면 GitHub Actions 로그에서 메모리 정보를 지속적으로 확인할 수 있도록
해당 플래그를 적용할 것을 추천해 드립니다 👍